Compound Interest Graph
By Zakrisdal Tech AB
- Category Finance
- Release Date 2019-07-18
- Current Version 1.2
- File Size 17.03 MB
- Links Google Play
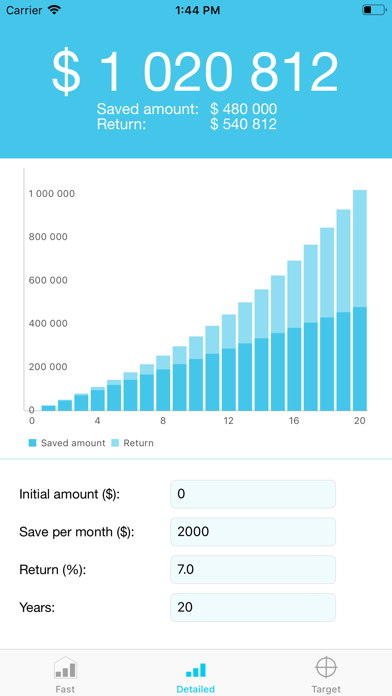
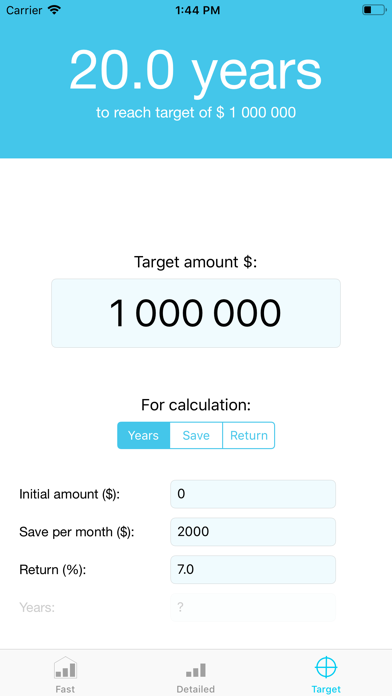
With the support of several tools and graphs** you will get a clear visualization how your capital grows over time for different levels or savings/investment amounts! The following features are available: - Total kapital calculated according to compound interest for different levels of investment, initial capital, return and years Choose between three different interfaces: - Fast: Fast result with pre-defined picker view levels of initial capital, monthly investment, return and years - Detailed: Free and manually defined levels of initial capital, monthly investment, return and years - Target: Choose a target capital amount and calculation of one of the variables: years, monthly investment and returns ** All charts are created with the Charts framework, developed by Daniel Cohen Gindi. The Charts framework is available here: https://github.com/danielgindi/Charts