Desmos Graphing Calculator
By Desmos
- Category Education
- Release Date 2013-06-18
- Current Version 7.32.0
- File Size 19.69 MB
- Links Google Play
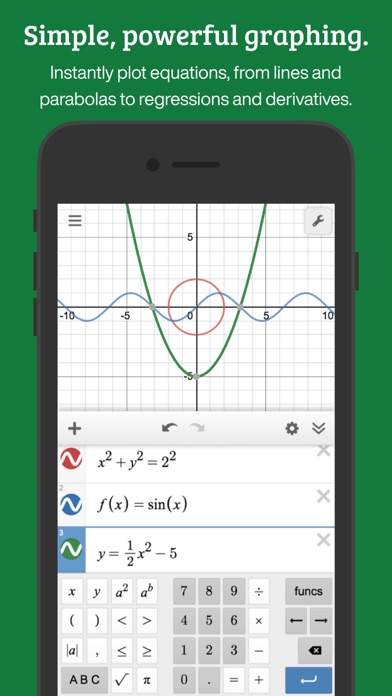
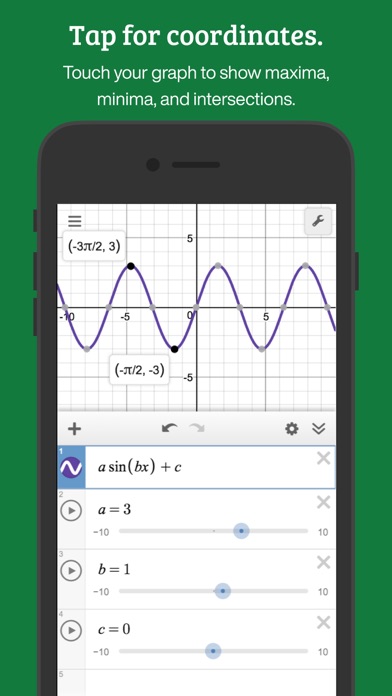
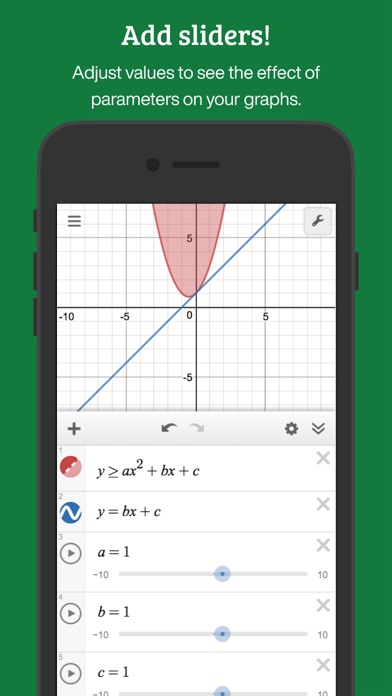
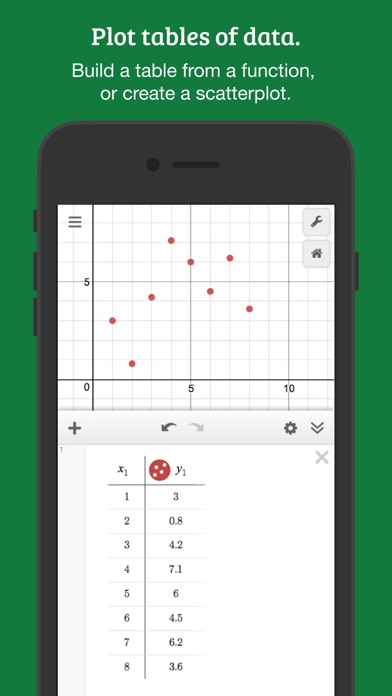
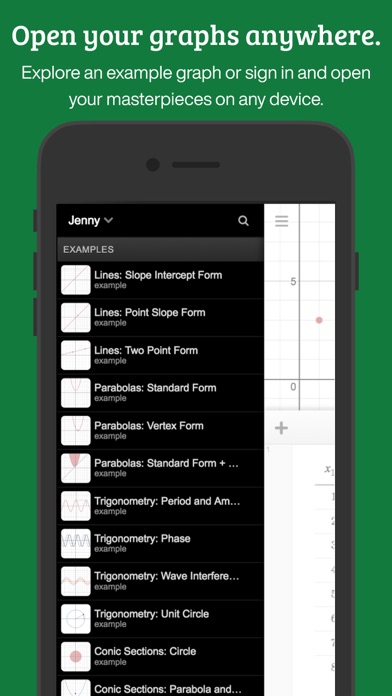
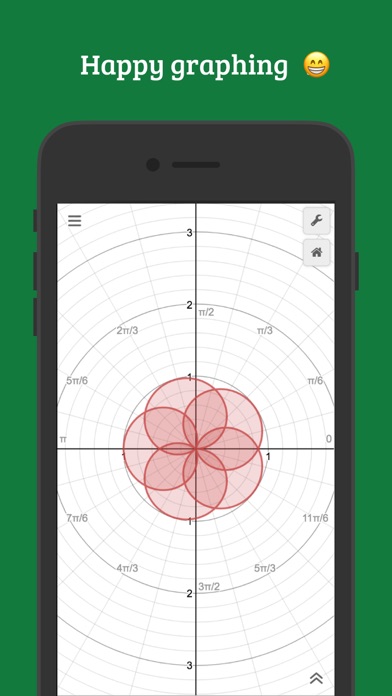
Explore math with the fast and powerful Desmos Graphing Calculator. Plot any equation, from lines and parabolas to derivatives and Fourier series. Add sliders to demonstrate function transformations, create tables to input and plot data, animate your graphs, and more—all for free. Features: Graphing: Plot polar, cartesian, or parametric graphs. There’s no limit to how many expressions you can graph at one time—and you don’t even need to enter expressions in y= form! Sliders: Adjust values interactively to build intuition, or animate any parameter to visualize its effect on the graph. Tables: Input and plot data, or create an input-output table for any function. Statistics: Find best-fit lines, parabolas, and more. Zooming: Scale the axes independently or at the same time with the pinch of two fingers, or edit the window size manually to get the perfect window. Points of Interest: Touch a curve to show maximums, minimums, and points of intersection. Tap the gray points of interest to see their coordinates. Hold and drag along a curve to see the coordinates change under your finger. Scientific Calculator: Just type in any equation you want to solve and Desmos will show you the answer. It can handle square roots, logs, absolute value, and more. Inequalities: Plot Cartesian and polar inequalities. Accessibility: Read and edit math using a screen reader or a refreshable Braille display, and use audio trace to explore graphs and data through sound. Offline: No internet access required. Visit www.desmos.com to learn more and to see the free browser version of our calculator.